Bangalore: The Battle of Neighborhoods
Restaurant Densities in Bangalore
Background
Bangalore is the capital of the Indian state of Karnataka with a population of over 10 million (density of over 10000 per sq. km) [1][2], making it the third most populous city in India.
As a result of the high population density, owners of shops end up sharing places. From the point of view of investors, they would prefer to set up businesses in neighborhoods where the competition is less intense.
For both residents and travelers, exploring various neighborhoods and venues is a good way to relax during weekends and holidays. The diversity of the cuisine available is reflective of the social and economic diversity of Bangalore. Bangalore has a wide and varied mix of restaurant types and cuisines and Bangaloreans deem eating out as an intrinsic part of their culture. Roadside vendors, South Indian, North Indian, Chinese and Western fast food are all very popular in the city [1].
Considering the above points, creating a map of Bangalore with districts grouped together with the help of clustering according to the venue, specifically restaurant density would be helpful.
Data Description
The data needed to solve the problem includes
- A list of neighborhoods in Bangalore, the capital city of the state of Karnataka in India which defines the scope of the project;
- Latitude and longitude coordinates of those neighborhoods to get the venue data and for mapping and visualization;
- And finally, venue data, particularly data related to venues to perform clustering on the neighborhoods.
Wikipedia contains a list of neighborhoods in Banaglore (with a total of 128) [3]. Web scraping techniques were used to extract the data from Wikipedia. Foursquare API was used to get the venue data for those neighborhoods.
Unfortunately, public data related to demographic and social parameters for all the neighborhoods in the city of Bangalore was not readily available and hence could not be used to refine the study further.
Methodology
The master data's main compnents were Neighborhood, Latitude and Longitude as depicted below for the city of Bangalore.

Visualization of the geographic details of Bengaluru was then carried out; the neighborhoods were superimposed on top as bullet points using their respective latitude and longitude values.

Foursquare API [4] was then used to explore the neghborhoods and segment them. The limit was specified such that the top 100 venues were returned within a radius of 2 km.

Foursquare returned over 6000 venues for all neighborhoods except in Agara which did not return any search results. A Word Cloud was then produced to filter out and highlight popular or trending venues based on frequency of occurrence.

One hot encoding was then carried out to group more than 200 venue categories by neighborhood.
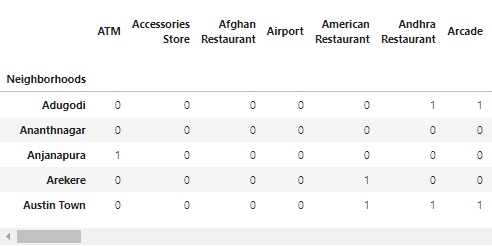
It was noticed that over 2000 venues were classified as restaurants. The count of the total number of restaurants was then computed and combined together into a dataframe with latitude and longitude values for each neighborhood to prepare the data for clustering.

One of the most common unsupervised learning, namely the K-Means algorithm was then used to cluster the neighborhoods. The algorithm was run with different cluster numbers to try and identify the optimal number for learning.
The inertia plot (which shared a close resemblence to the figure shown below) did not provide a clear elbow point but it was decided to go with 6 clusters to try to differentiate the centre from various Cardinal peripheries.

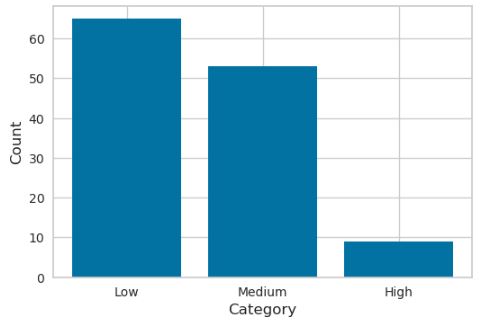
The neighborhoods were then classified as follows to represent restaurant density:
- 0-19 Restaurants: "Low";
- 20-39 Restaurants: "Medium";
- Over 40 Restaurants: "High".
Using visualization techniques, the clusters were then plotted on a map of Bangalore for interpretation
Results
Over 50 percent of the neighborhoods fall under the "low" density category regarding restaurant density and fewer than 10 neighborhoods fall under the "high" density category.
Visualization uisng a 3D Scatter plot did not produce interpretable results; this was resolved by using a map plot as shown below.
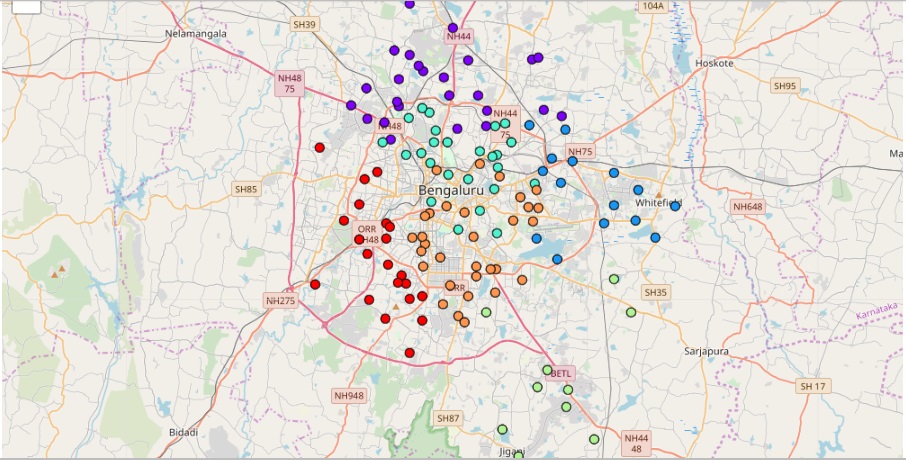
The restaurant cluster obtained from unsupervised learning are
- Cluster 0: West/South West Bangalore with low densities;
- Cluster 1: South Bangalore with low densities;
- Cluster 2: East Bangalore with low to medium densities;
- Cluster 3: North Bangalore with low densities;
- Cluster 4: Central Bangalore - North Zone with medium densities;
- Cluster 5: Central Bangalore - South Zone with medium to high densities.
The results are intuitive as the restaurant densities in most of the neighborhoods are mostly low at the peripheries of the city and higher toward the center.
Some of the neighborhoods in the vicinity of the Marathahalli/Whitefield area have medium densities which can be explained by development as a result of the presence of numerous corporate offices.
There are a couple of neighborhoods which have been misclassified in Clusters 4 & 5 since there are almost no high density restaurants in Cluster 4 which is one of the limitations of the learning algortithm.
A copy of the working notebook is available here.
Conclusion
There is a high demand for varied cuisine in the city of Bangalore and this is confirmed by Foursquare data.
Data on demographics and employment wasn't available to assess people's spending power but analysis of the data available at hand seems to show untapped market potential in those neighborhoods away from the center of the city and this information could be useful to a restaurateur.